top of page
Infographics
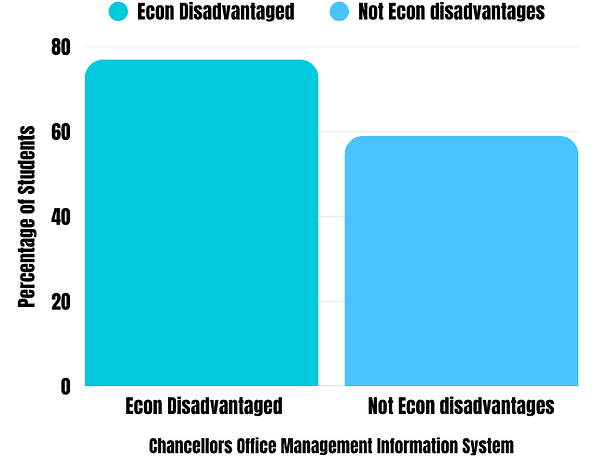
Infographic made about Citrus College students
This infographic shows the percentage of students that are economically disadvantaged compared to students that aren't
Film Box Office Success vs Critical Acclaim
This Infographic shows major US film distributers and how much of the US box office percentage they received. On the right side the percentage of critical output for the year 2024 is shown.
.png)
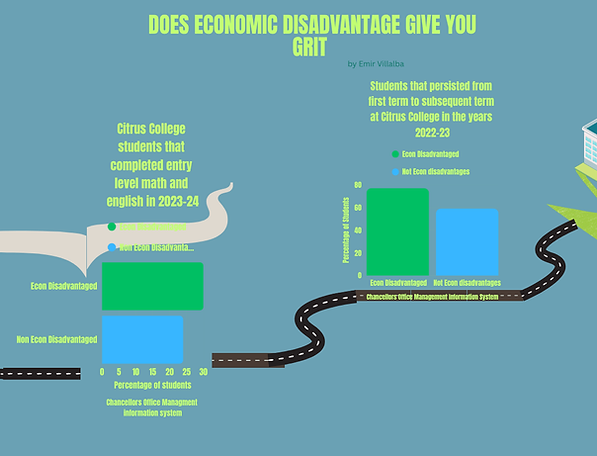
Does student grit Increase if their economically disadvantaged?
This infographic is meant to support the idea that students with a low income background tend to strive more in school. The number of economically disadvantaged students that completed entry level math and english compared to non economically disadvantaged students is shown. Along with the number of students that continued to attend citrus college.
bottom of page